The (ideal) relationship between corporate goals and learning analytics
When a company needs to cut costs, L&D departments are often the first to feel the pinch. Professional development costs money without providing a tangible benefit. That is, the lack of directly verifiable benefit is often cited. However, L&D organisers can disprove this assumption if they examine learning analytics in more depth. We are answering the most pressing questions on this topic and offer practical tips.

It comes as little surprise that corona has driven investment in digital training platforms and e-learning in general. Yet, this is not a new trend. Back in 2019, figures published by Fosway Group already pointed in this direction: More than 60% of the interviewed companies stated that their expenditure for learning platforms and e-learning contents had significantly increased.
Greater numbers of digital training courses and higher costs drive demand for higher quality learning content, while also intensifying the focus on the actual business outcome. What exactly are employees learning? What purpose does it serve? How does it help my company’s development? How can I determine the impact professional development has on my revenue, for example?
This is exactly where learning analytics comes into play. Here’s a quick outline of what that is all about, and how to map business outcomes in a meaningful way.
What does learning analytics mean?
The term “learning analytics” comes from the traditional IT sector. It means that data on learning and learners is analysed to arrive at decisions based on this data.
Where is learning analytics applied?
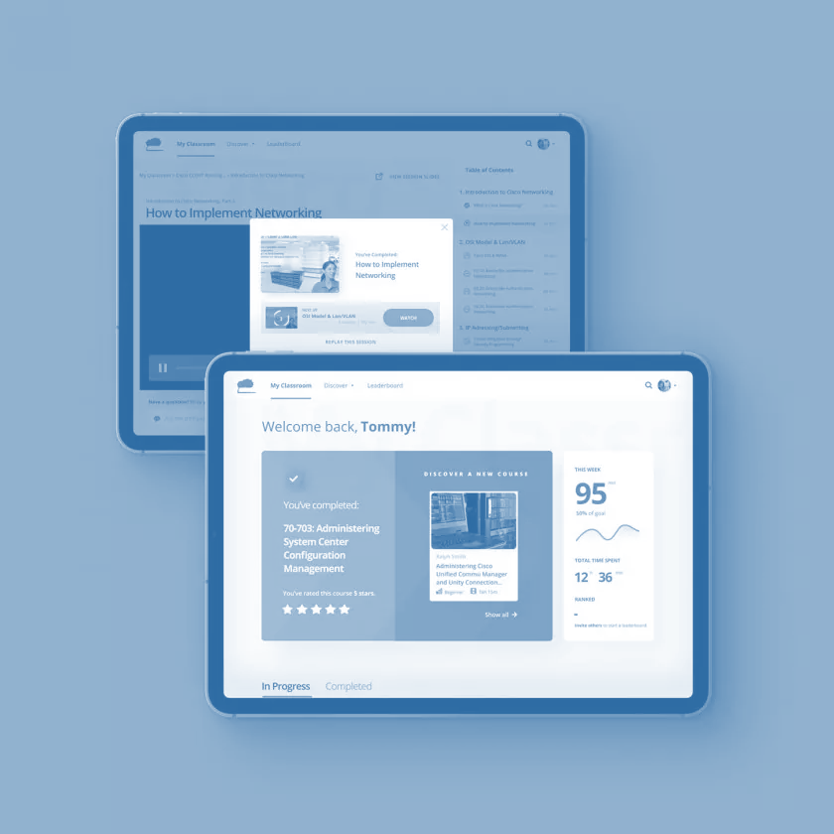
Traditionally, learning analytics methods are used wherever learning data is generated. While different analysis tools are available, this is typically done directly in a company’s learning management system (LMS).
What is measured?
Typical examples would be information on the number of participants booked onto a particular course, the total e-learning hours booked in a given month, or the number of certificates issued.
However, this is all fairly basic information that offers little insight by itself, and should be linked to other reference points.
How should learning analytics be used?
Things become really interesting when learning analytics is leveraged to look at selected data in relation to other data, and analyse it in terms of the business outcome.
An example: One region is experiencing a more pronounced increase in bookings for training courses and course completion. Yet, revenues are stagnating. Meanwhile, revenues in a comparable region shows strong growth after the same number of training hours. The analysis now needs to dig a lot deeper to draw sound conclusions from these figures.
The right questions need to be asked. For instance: How did the participants rate the courses? Did the booked courses match the learners’ skills level? Did the courses challenge too much or too little? What was the dropout rate? Did the course content cover topics relevant to employees in that region?
If the answers show a discrepancy between course content and expectations, this can be addressed directly. At this point, artificial intelligence (AI) technologies can also be integrated to develop recommendations for action.
How does the analysis with LMS dashboards work?
Learning management systems provide a variety of role-specific standard reports, which provide information on qualitative and quantitative elements of learning.
In addition, it is possible to select relevant data and use it to create customised reporting dashboards, for which automated generation on specific dates can be set up. The results can be visualised through pie, bar and line charts, as specified for each analysis.

Wolfram Jost, board member in charge of products at imc calls on companies to look at the relationship between business outcomes and learning content, offering the following summary: “Learning analytics must be leveraged to promote employee performance in a way that supports corporate goals and business outcomes. The value created through professional development programmes only becomes apparent when corporate figures are included in the analysis.”
His three top tips to get started with learning analytics and business outcomes are:

Dr. Wolfram Jost, board member at imc
1. Less is more
Select data that is truly relevant, and use it as a basis for simple dashboards that provide a clear overview. Information overload leads to confusion.
It is also important to pay attention to data protection requirements, and to keep asking yourself what data is necessary for a meaningful analysis.
2. Data is King
While large quantities of data (massive data) are needed to run an analysis in the first place, it only becomes truly reliable if that data is also of a high quality and reports are generated on a regular basis. Continuity and regular data updates are crucial.
Moreover, data must be presented in a form that allows the relevant stakeholders to interpret the resulting data in a meaningful way to harness its full potential.
While data should support decisions made by people and data analysis is a useful tool for decision-makers, it still needs to be scrutinized. “Dictatorship of data” - assigning data actual decision-making powers - should be avoided.
3. Trend is your friend
One-off figures or reports say little. Relationships and developments are identified by keeping an eye on trends. In which direction is revenue trending after a new professional development initiative is launched? Will the staff turnover rate decrease after a new onboarding programme is launched?
It takes time before this kind of information can be validated in a useful way.
With these tips in hand and an experienced data analysis team by your side, you will be able to substantiate the value created through your professional development programmes in the medium and long term, and optimise them in accordance with your corporate goals.
More about Learning Analytics
In our whitepaper about Learning Analytics we discuss the challenges, KPIs and some useful tips to turn your big learning data into actionable learning strategies and measurable business success.

How to: LMS migration
When a new learning management system (LMS) is needed, sound advice is hard to come by.
We have collected tips from industry experts, and summarised the key questions and answers in our FAQ checklist.

AI in corporate learning
Around the topic of artificial intelligence (AI) are many fears, anxieties and uncertainties.
But what AI in the LMS can do and already does is mostly still unclear. We explain the most important terms and applications.
More information about the LMS
If you would like to find our more about the Learning Management System of imc, please find all information here.
Contact
I have been working in the Marketing & Communication Team at imc since March 2019.
Communication, creative content and social media are my passion. "KISS - Keep it short and simple" is my credo.
To explain complex content in an understandable way and thus make the topic of e-Learning accessible to everyone is an exciting challenge every day.
Privately I love to read, play poker and travel a lot.
I am always happy to receive feedback or suggestions.